Md Mahmudul Hasan

Data Analyst | Power BI • Tableau • SQL • Python | Dashboards • Data Quality • Reporting Automation

My workflow: Intake → Validate → Reconcile → Analyze → Visualize → Stakeholder Support
Focus KPI dashboards & metrics Ops reporting automation Quality reconciliation & validation Tools Power BI · Tableau · Streamlit

I turn messy operational and financial datasets into decision-ready dashboards and reliable reporting pipelines—so teams can move faster and trust the numbers.

Short on time? One project below gives the best overview before the resume.

Featured Projects

Three fast examples. Each one shows problem → build → outcome.

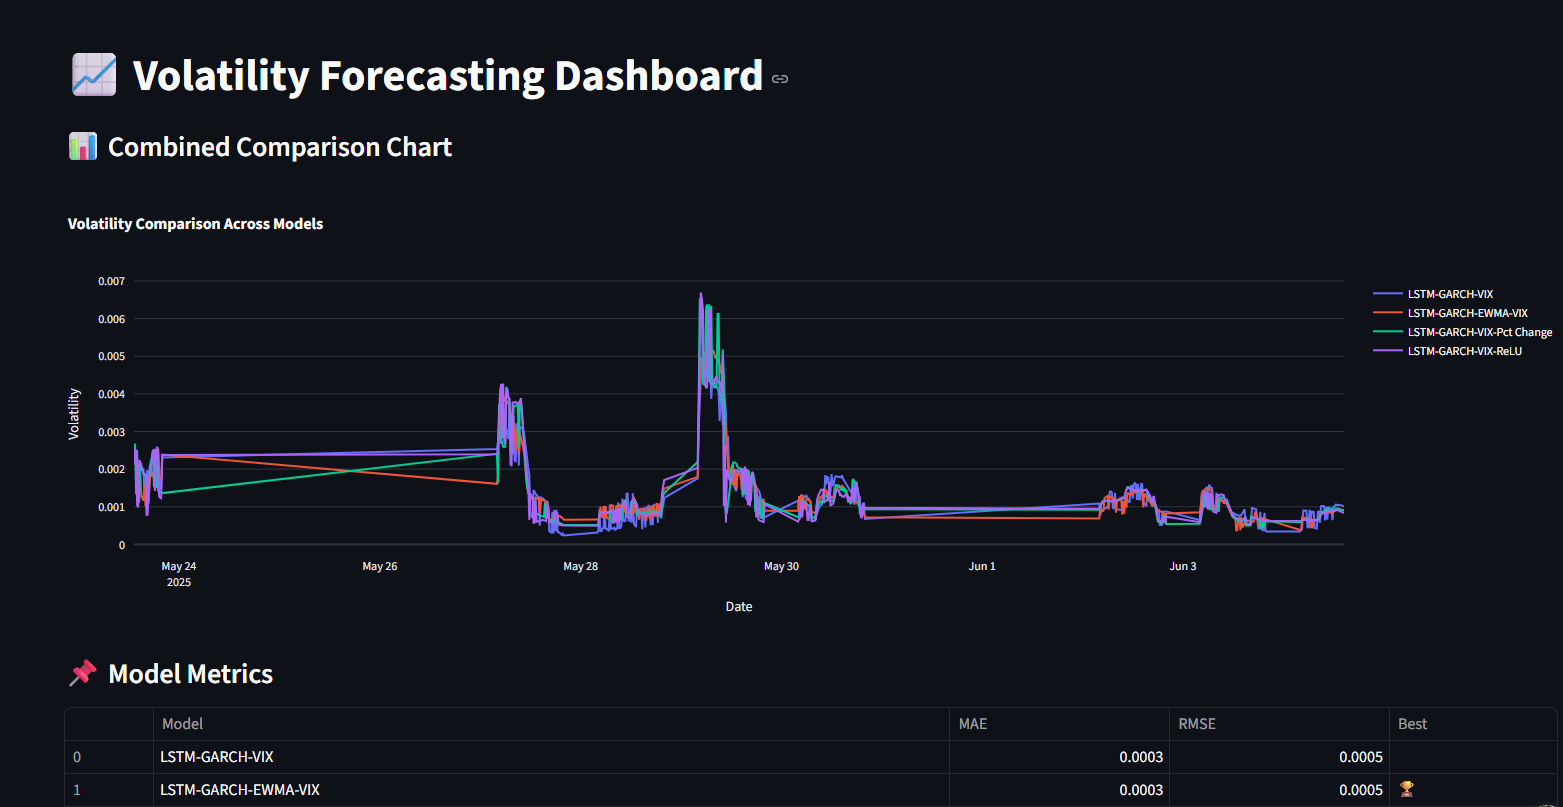
Dashboard screenshot: Intraday volatility forecasting Streamlit app

Intraday Volatility Forecasting Dashboard (Streamlit)

Streamlit | SPY 15-min + VIX | GARCH vs LSTM vs Hybrid
  • Problem: compare volatility models on high-frequency SPY data and explain performance clearly
  • Build: interactive Streamlit dashboard to benchmark GARCH, LSTM, and hybrid variants using MAE/RMSE and walk-forward evaluation
  • Outcome: faster, stakeholder-friendly model selection with a single dashboard view of accuracy and stability
Dashboard screenshot: Operational Reporting

Operational Reporting Dashboard

Power BI | KPI reporting | Data validation
  • Problem: reporting required manual checks and inconsistent inputs
  • Build: standardized KPIs + validation checks + refresh workflow
  • Outcome: faster stakeholder reporting and clearer performance visibility
Dashboard screenshot: Data Quality & Reconciliation

Data Quality & Reconciliation Checks

Python | SQL | Exceptions & discrepancy tracking
  • Problem: mismatched values across sources delayed reporting
  • Build: reconciliation rules + exception summaries + audit trail
  • Outcome: fewer discrepancies and higher confidence in outputs

Skills Map

DataSQL, CSV/Excel, APIs, operational & financial datasets
AnalysisPython (pandas), R, trend & anomaly checks, KPI design
VisualizationPower BI, Tableau, Streamlit; stakeholder-ready dashboards
QualityValidation rules, reconciliation, discrepancy investigation
OpsReporting workflows, documentation, SOPs, support

How I work

  1. Clarify the business decision and define the KPI(s)
  2. Audit data sources and establish validation rules
  3. Build automated refresh and reporting pipelines wherever possible
  4. Design the dashboard for one-glance comprehension
  5. Document it (SOP) so it survives team turnover and handoffs
Want this mapped to your role?
I can tailor these projects to a job posting and show the exact KPI map it would use.

Contact

Email LinkedIn GitHub

Location: Canada (Moncton/Fredericton/Halifax)