Projects
Each project is a short case study: Problem → Data → Build → Outcome.
1) Intraday Volatility Forecasting Dashboard (Streamlit)
Streamlit | SPY 15-min + VIX | GARCH vs LSTM vs Hybrid
Problem
Stakeholders needed a clear, reliable way to compare intraday volatility models and understand which approach
performed best on high-frequency market data. Tables/scripts and static plots made side-by-side comparison and
communication difficult.
Data
SPY ETF intraday price data (15-minute frequency) with VIX as an exogenous volatility indicator; engineered
features including log returns, rolling volatility, EWMA, and lagged volatility terms.
Build
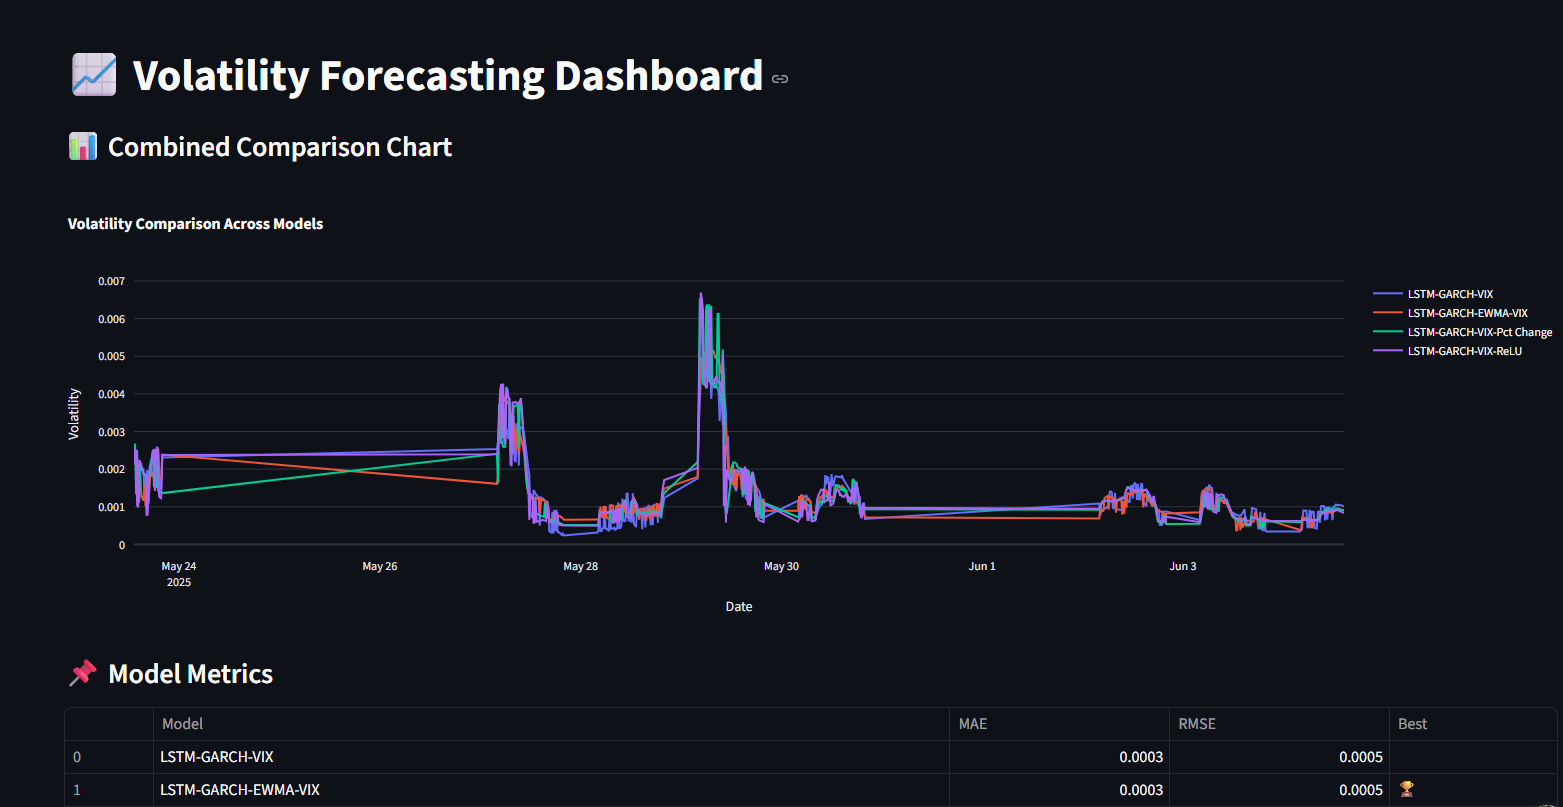
Built an interactive Streamlit dashboard to benchmark GARCH, LSTM, and hybrid GARCH–LSTM–VIX variants using
walk-forward evaluation. Visualized performance with MAE/RMSE and forecast-vs-actual comparisons, with
structured explanations for non-technical readers.
Outcome
Enabled one-glance model comparison across accuracy and stability, reduced manual analysis by consolidating
metrics and visuals in one place, and improved decision support through transparent, reproducible results.
2) Operational Reporting Dashboard
Power BI | KPI reporting | Data validation

3) Data Quality & Reconciliation Checks
Python | SQL | Discrepancy tracking
Problem
Mismatch across systems caused delays and rework.
Data
Two or more sources requiring reconciliation.
Build
Rules + exception report + audit trail + documentation (SOP).
Outcome
Fewer discrepancies and improved data trust.